Assignment #2: Oh crap, Zombies!
- Worth: 10%
- DUE: October 26th; submitted on OWL by 11:55.
- Starting point: asn2.py
Our first assignment dealt with data analysis. We’re going to do a lot more of that, but it’s important to get some exposure to another very important area of modern science: computational simulation. If you can simulate something accurately enough, the simulation might have real advantages over actually doing an experiment.
For example, if you simulate a protein folding – and get it right – you can actually stop, rewind, replay, and even do matrix-style ‘bullet time’ pans around the protein, as it folds. This allows you to watch interactions on a level of detail that is completely impossible experimentally. (Check out Vijay Pande talking about Folding@Home )
Simulations also let you do things you simply can’t do in reality. Suppose you’re a social geographer who wants to study the social impact of different types of natural disasters on a small fishing village. You’d have difficulty getting ethics approval to flood an actual village, or bury it in lava, and then collect data. If, however, your ‘villagers’ exist only in a simulation... there are no constraints on what you can do.
For this assignment, you will be simulating the outbreak of a ZOMBIE APOCALYPSE. Specifically, you’ll be writing code to simulate the spread of zombies through a network of cities. Once your simulation is working, you’ll write a bit more code to analyze the data produced by your simulation to determine exciting things like how long it will take for the world to end.
How to approach the assignment
Once again, you are asked to extend existing code. Extending existing code can actually be more challenging than writing code from scratch but, as a scientist using programming as tool, this is what 90% of your real-world programming will be.
For the first assignment, you just had to get the code working. For this assignment, it also has to look pretty... by which I mean:
- There should be comments in the code
- Functions should have headers explaining what they do in plain English
If you’re not sure how those things should look, use the existing code as a guideline.
Speaking of the existing code... The first thing you should do is download the existing code and take a quick look at it. Just skim it. Some of
the provided functions call on rather complex Python libraries and may look very confusing to you. That’s totally normal.
What you really want to look at are the descriptions in the function headers. Right after the def line, you’ll see some
text wrapped between “”” and “””. Read this carefully. This tells you everything you need to know about how to use that
function – without you having to understand how all the details of the function work. That is: you can work one level of
abstraction higher than the function.
So... look at that code. Seriously. Do it. Familiarizing yourself with what’s going on in the file is the best possible preparation for doing the assignment.
Data structures you need to know about
Every city in our simulation is going to be represented by a list [name,infected,neighbours]
nameis a string with the name of the city.infectedis abool.Trueif the city has zombies,Falseif it doesn’t.neighboursis a list (so we’ve nested a list inside a list!) containing the city numbers of the cities that can be directly reached from this city.
Our world is made up of multiple cities. How can we store all these cities? In another list, of course! So the world is a list of lists:
world = [city1, city2, city3, ...]
Getting started
To make your life easier, I’ve provided a function called set_up_cities that will randomly generate some cities,
and connections between those cities, for you. If you call this function, it returns a list of cities, detailing the
state of your simulated world. You’d use the function like this:
>>> my_world = set_up_cities()
Note
If you don’t like the (boring) default names for the cities, note that there is an optional name parameter
for this function. This lets you pass in your own list of city names if you want to (it also allows you to
create a world with fewer, or more, cities). Apologies for the boring names, but I didn’t want use real cities to avoid traumatizing any
class members who may have lost a loved one to a zombie outbreak in those cities).
You should probably load up the asn2.py in your interpreter right now and play around with the set_up_cities() function
just to get a feel for it. Have a look at the lists it generates and make sure you understand their structure.
Coding, Part I
Write the following functions:
zombify(cities,cityno). This function takes your list of cities as the parametercitiesand an integercitynospecifying which city in the list should be infected. So, to infect city 2, you might use the function like this:>>> my_world = set_up_cities() >>> zombify(my_world,2)
How do you “infect” a city? Well you have to set the “infected flag” for that city to True. In other words, set
cities[cityno][1]toTrue. The[cityno]indexes a particular city in the list of cities (cities) and the following[1]indexes the second element (remember, the first element is[0]!) in the list that makes up that city description.cure(cities, cityno). The opposite ofzombify. Clear the infection flag for the city.sim_step(cities,p_spread,p_cure). This is the most important function in the assignment. This function will execute a single time step of your simulation. Depending on how fast you want to think of your zombies spreading, that time step could be a day, an hour, a week, whatever. When modelling a real zombie outbreak, you’d determine the size of your time step from the empirical data. Here is some English-language “pseudocode” for function. You’ll have to turn it into Python:for each city in cities: if the city is infected and numpy.random.rand() < p_spread: choose a victim city (at random -- hint: numpy.random.randint()) from the list of this city's neighbours infect the victim city! if the city is infected and numpy.random.rand() < p_cure: cure the city! Make sure that city 0 *always* has zombies. It can't be cured.So, what’s going on there? Well,
numpy.random.rand()isn’t so much pseudocode as actual Python code. It generates a random number between 0 and 1 every time you call it. Think of it like rolling dice. The parameterp_spreadis the probability of the zombie plague spreading and the parameterp_cureis the probability of the plague being cured. For starters use values of 0.5 forp_spreadand 0.0 forp_curewhile you’re getting things working. We’ll play with these later. (Note: a value of 0.0 means it will never happen, and a value of 1.0 will mean that it always happens.)
Once you’ve done this, you now have a working zombie apocalypse simulator! So spend some time testing it in the Python shell. Something like this:
>>> my_world = set_up_cities()
>>> zombify(my_world,0)
>>> draw_world(my_world)
>>> sim_step(my_world, 0.5, 0)
>>> draw_world(my_world)
>>> sim_step(my_world, 0.5, 0)
>>> draw_world(my_world)
>>> sim_step(my_world, 0.5, 0)
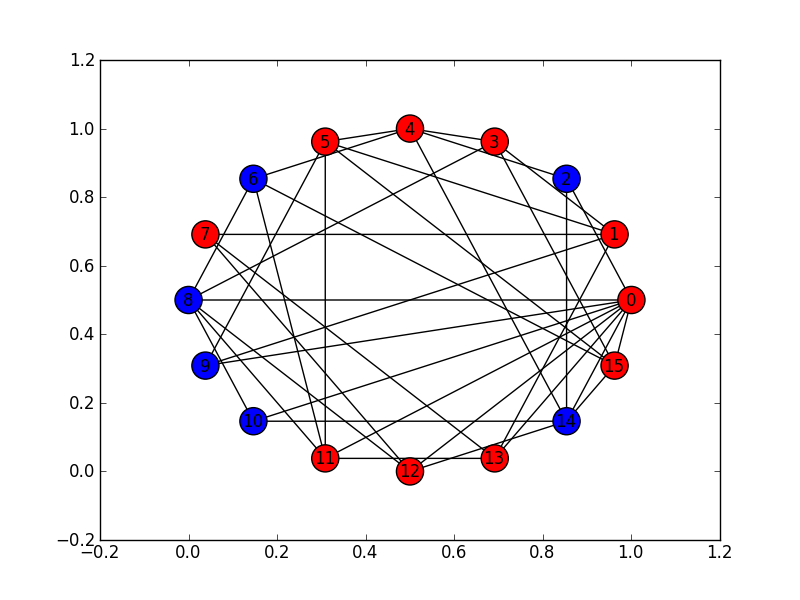
The function draw_world is one that’s already written for you. It graphically displays the state
of your world. Cities are red circles if they have zombies and blue circles if they’re clean. If zombies
can travel between two cities, there is a line drawn between the cities. If you update this display after
each sim_step you can watch your zombies spread! It’ll look something like this:
If you’re running ipython from the command line, you may have to run it like this to get the graphics to work:
$ ipython --pylab
Alternatively, you can import the plotting tool with the code:
import matplotlib.pylab as plt
If you do this however, you will need to add plt. before all of the plotting functions. This shouldn’t really become a problem, but if it does, then have a look at the draw_world function as it uses the above code. In other words, if your plotting worked fine, then ignore all this.
If you get tired of typing sim_step for every single step... you could always automate the process
with a function that calls sim_step in a loop!
Once you’re convinced that your zombie simulator works, move on to Part 2. If your simulator isn’t working yet GET IT WORKING BEFORE PROCEEDING.
Working now? Good. Make sure it’s commented and has function headers.

Part I — FAQ:
- My drawing looks different every time!
- I know, it should, it’s random every time.
- My drawing isn’t updating for each step!
- This might be happening because it’s running so fast. Try calling each function once at a time in the interpreter.
- I don’t know how to do X.
- OK, go to google.ca and type in X.
- My thing keeps telling me ERROR: File `u’SOMETHING’` not found.
- Then the file isn’t where python is looking.
- Wtf do the functions do that you gave me?
- Read the descriptions.
- Some of the code in the functions you gave us look like magic.
- That’s because it’s magic.
- Do I have enough comments?
- I don’t know, maybe? If you’re looking at code and have to ask if you should comment it... just comment it. That said, don’t write me a book.
Coding, Part II
As fun as it is to watch our zombies spread, we’d like to gather some hard data on the results of our simulations. In particular, top government officials want to know how long it will take for the world to end in the event of a zombie apocalypse.
Write the following functions:
is_end_of_world(cities). Loop through all the cities in the listcities. If all of them are infected, returnTrue(it’s been nice knowing you). Otherwise, returnFalse.time_to_end_of_world(p_spread,p_cure). Run a simulation, for specific values ofp_spreadandp_cureand count how long it takes the world to end (which you can now test withis_end_of_world, of course). Some pseudocode for you:set up a new list of cities ( ``world = set_up_cities()`` ) zombify city 0 initialize an end-of-world counter while the world hasn't ended: sim_step(world,p_spread,p_cure) increment the end-of-world counter return the value of the end-of-world counter
Now, to run an experiment to see how long it takes the world to end, all we have to do is:
>>> time_to_end_of_world(0.5,0)
We’ve got a problem though. Our simulation is stochastic: we are making
use of random numbers to determine outcomes. We can’t just run our simulation once and count the number
of steps until every city is infected. If you don’t believe me, just try it. Call the time_to_end_of_world
function a few times. Do you get different values? Wildly different? Yeah, that’s what I thought. WTF do you do now?
We have to run our simulation many times to fairly sample the space of possible outcomes. In essence, simulation is a lot like experimentation; we have to do multiple experiments to get some statistical confidence in our answer.
So, write another function:
end_world_many_times(n,p_spread,p_cure). This function should initialize a list of results and then use a loop to runtime_to_end_of_world(p_spread,p_cure)a total ofntimes. After each simulation, add the time it took for the world to end to the list. Return a list ofn“times to the end of the world”.
All set? Make sure it’s commented and has function headers. Then go on to the analysis.
Analysis
Now we get to play with our simulator to answer burning public health questions about zombie outbreaks. Play with the
values of p_spread and p_cure. How does changing those values change the “time to the end of the world”?
Answer the following specific questions, and provide evidence from your simulation to support your answer:
- Fix the value of
p_cureat zero. How does varying the value ofp_spreadaffect the time to the end of world? - Fix the value of
p_cureat 0.05. How does varying the value ofp_spreadaffect the time to the end of world? - Fix the value of
p_spreadat 0.5. How does varying the value ofp_cureaffect the time to the end of world? - Pick three pairs of
p_spread,p_curevalues that you think are interesting. Run 500 simulations for them (e.g,end_world_many_times(500,your_value,your_value). What does the distribution of times to the end of the world look like? If you’ve taken a stats course: is it normal (Gaussian)? (If you haven’t taken stats, just ignore the Gaussian question).
Big Hint
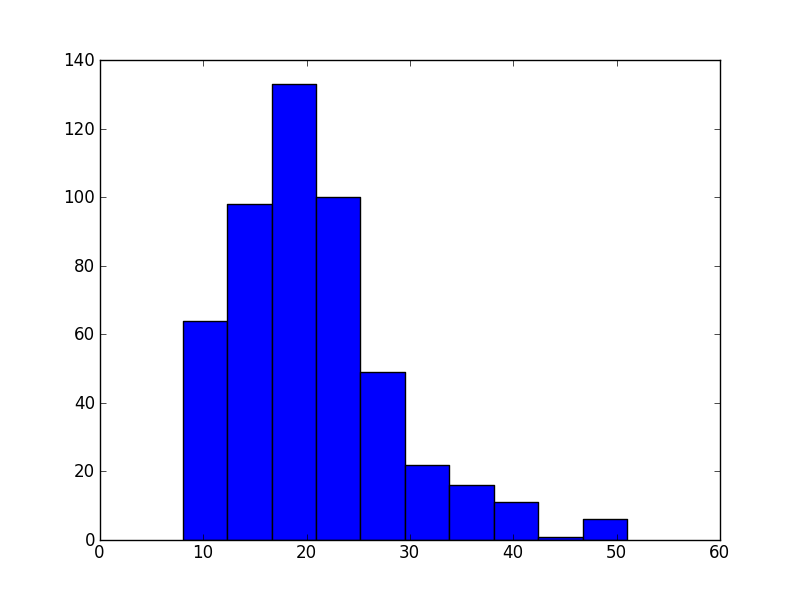
If you ran this command in the Python shell: ttl = end_world_many_times(500,your_value,your_value), you can
get a really pretty histogram (which tells you about the distribution) of the values in ttl with the command
hist(ttl).
Here’s a sample histogram of times to the end of the world for p_spread = 0.5 and p_cure = 0.0:
If you’re running ipython from the command line, you may have to run it like this to get the graphics to work:
ipython --pylab
Or you can do it the super simple way and write this in your code:
import matplotlib.pyplot as plt
If you do this, all you need to do is write plt.WHATEVER_THE_FUNCTION_IS_TO_PLOT_THE_TYPE_OF_PLOT_I_WANT(). Look up how to plot whatever type of plot you want.
Part II — FAQ:
- My histogram looks different from yours!
- I know, it should, it’s stochastic.
- My histogram looks different every time!
- I know... it should... it’s still stochastic...
- I don’t know how to do X.
- OK, go to google.ca and type in X.
- My thing keeps telling me ERROR: File `u’SOMETHING’` not found.
- Then the file isn’t where python is looking.
- Wtf do the functions do that you gave me?
- Read the descriptions.
- Some of the code in the functions you gave us look like magic.
- That’s because it’s magic.
- Do I have enough comments?
- I don’t know, maybe? If you’re looking at code and have to ask if you should comment it... just comment it. That said, don’t write me a book.
What to submit
- Your version of
asn2.py- Make sure your NAME and STUDENT NUMBER appear in a comment at the top of the program.
- List anyone you worked with in the comments, too
- Make sure it’s commented and has function headers!!
- Use proper variable names
- A text file answering the 4 analysis questions and providing data to back up your answers.